Consume OData Service in SAP Lumira Reporting Tool
Using SAP Lumira business intelligence developers and power users can consume OData services to create reports. This SAP Lumira tutorial shows how to consume OData service in Lumira.
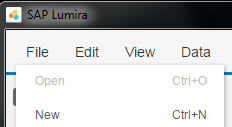
After you launch SAP Lumira follow below menu options to create a new dataset for your report.
File > New or use Ctrl+N shortcut keys
A wizard will guide the self-service BI user in his/her report development process.
First of all, the business intelligence user should select the data source for the SAP Lumira report.
As seen in below screenshot from "Add new dataset" wizard step, there are a bunch of data source types like Microsoft Excel documents, text files (or flat files), SQL data sources, SAP datasources like SAP HANA or SAP BW (Business Warehouse), or Hadoop data sources.
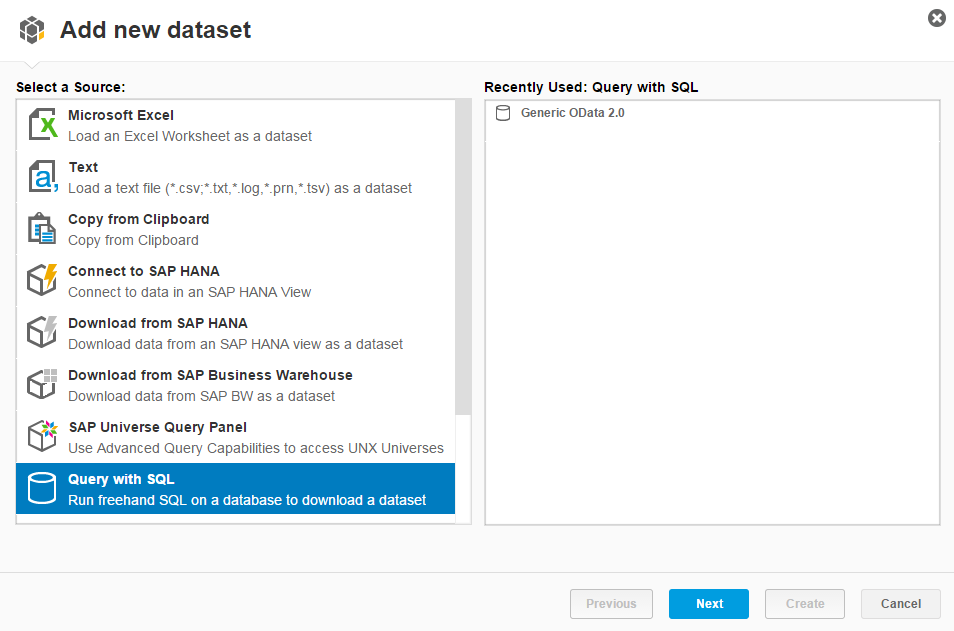
I know I did not mention OData among the first list of data source types. If you continue in your report creation task by selecting "Query with SQL" data source option and click Next button, you will see there are numerous database connections you can configure for your report.
At present when this SAP Lumira tutorial was prepared, the options for Query with SQL datasources were to query:
Amazon services (Amazon EMR Hive, Amazon Redshift),
Apache Hadoop Hive or Apache Spark,
Cloudera Impala,
Generic OData 2.0 - OData Connector,
Microsoft SQL Server,
Salesforce.com,
SAP ERP 6, SAP HANA database, mySAP ERP,
Sybase (Sybase IQ, Sybase SQL Anywhere, Sybase Adaptive Server)
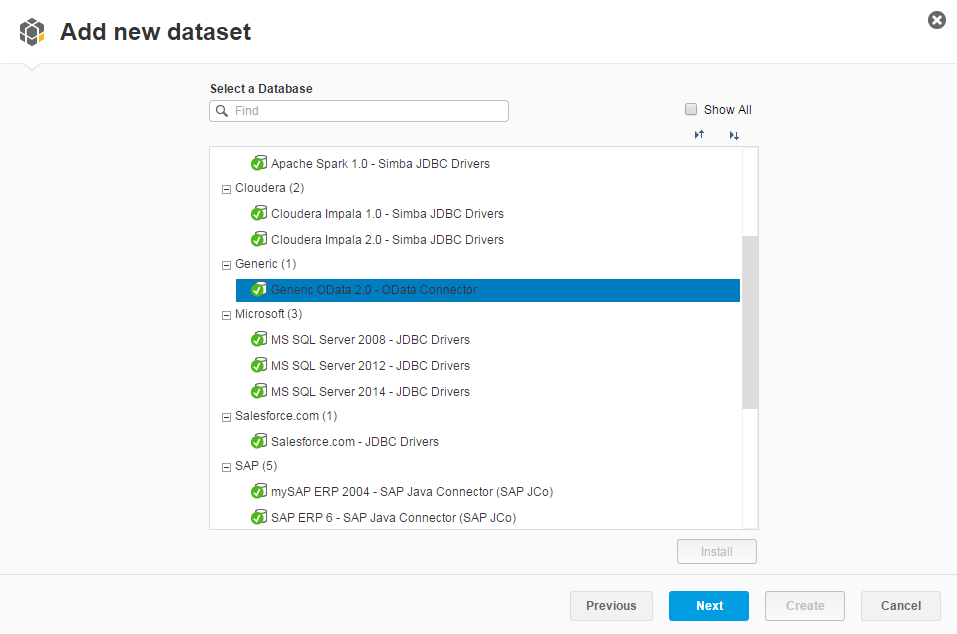
If you plan to consume OData service as the datasource of your SAP Lumira report data, highlight option Generic OData 2.0 - OData Connector and forward to following step using Next button.
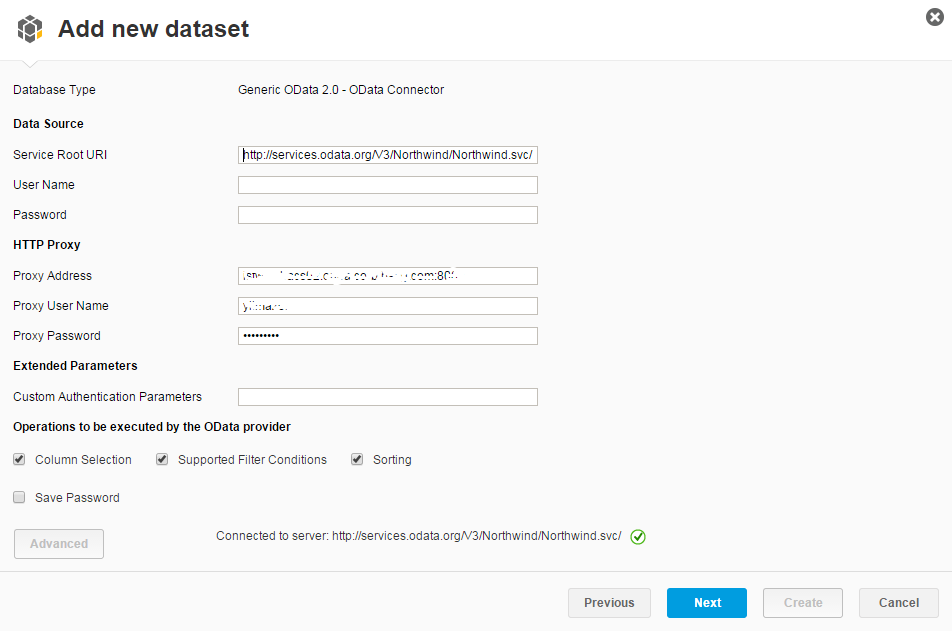
As you can see using below screen, BI developer or self-service BI (Business Intelligence) power-user can configure OData source for consuming OData service data for the report.
Service Root URI is the web URL of the OData service.
For this tutorial, I decided to use a public available free OData service.
So I choose http://services.odata.org/V3/Northwind/Northwind.svc/ from OData.org
Programmers can search for other free OData services on the web.
If you are developing your Lumira report in your company behind a proxy server and try to consume an OData service from internet, you can configure HTTP Proxy options for your dataset.
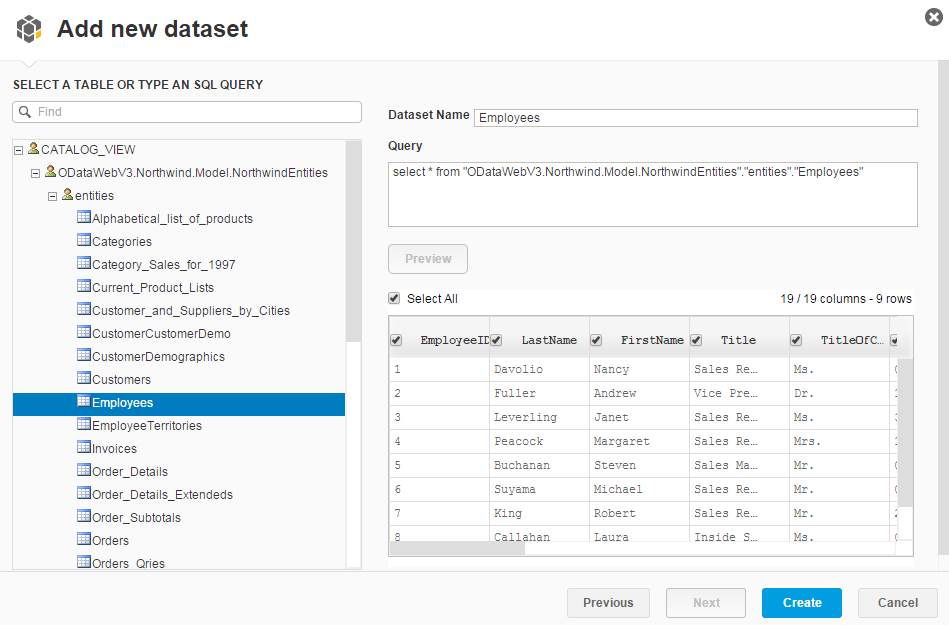
The next wizard screen displays data tables provided by the OData service. The BI user can choose one of the entities as the data source for the new report.
For example, when I select Employees entity from left, on the right side of the screen the user has options to edit default SQL query which is executed to fetch data from OData service.
After a dataset name is provided and you check the SQL Query on the view, the user can display data from OData service by pressing the Preview button.
There is an option to enable row count display, if you want you can mark it to see total number of rows served by the OData service.
One last thing on this screen, the report developer can unmark the column by clearing the corresponding checkbox on the table header row.
For better visual report data, I thought it is better to work on sales orders data.
For the SAP Lumira report, I selected Orders entity.
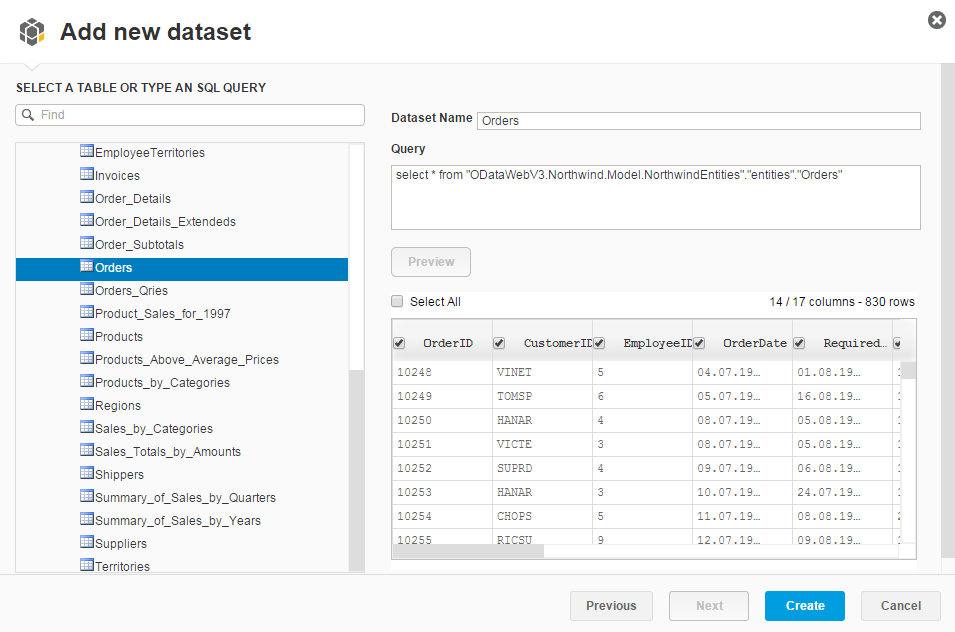
After small configuration options, press Create button to display the report in draft version.
The data source for our sample Lumira report is now ready. The report programmer can now concantrate on how to prepare data for the OData report like by data preparing, hiding or removing additional columns, assigning dimensions or creating new measures. The developer can easily create hierarchy dimensions like creating date/time hierarchy on date columns or like creating geography hierarchy on city, country names, etc or on spatial latitude/longtitude values.
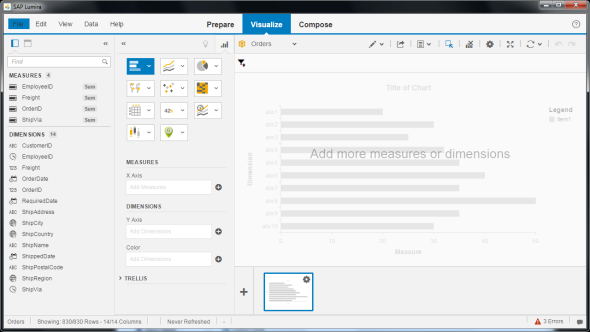
Following screens enables Lumira developers to format data from OData service for final report display and visualize the report using selected display visuals among numerouos reporting charts and displays.
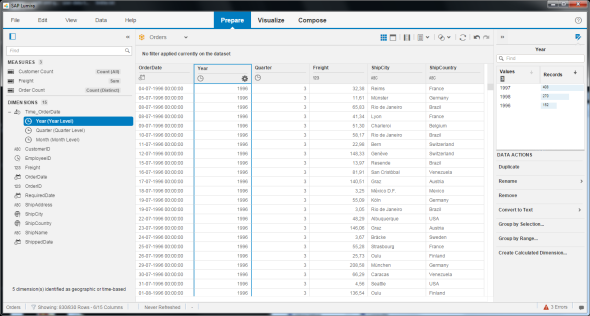
Here date/time hierarchy can be implemented easily on the Lumira report
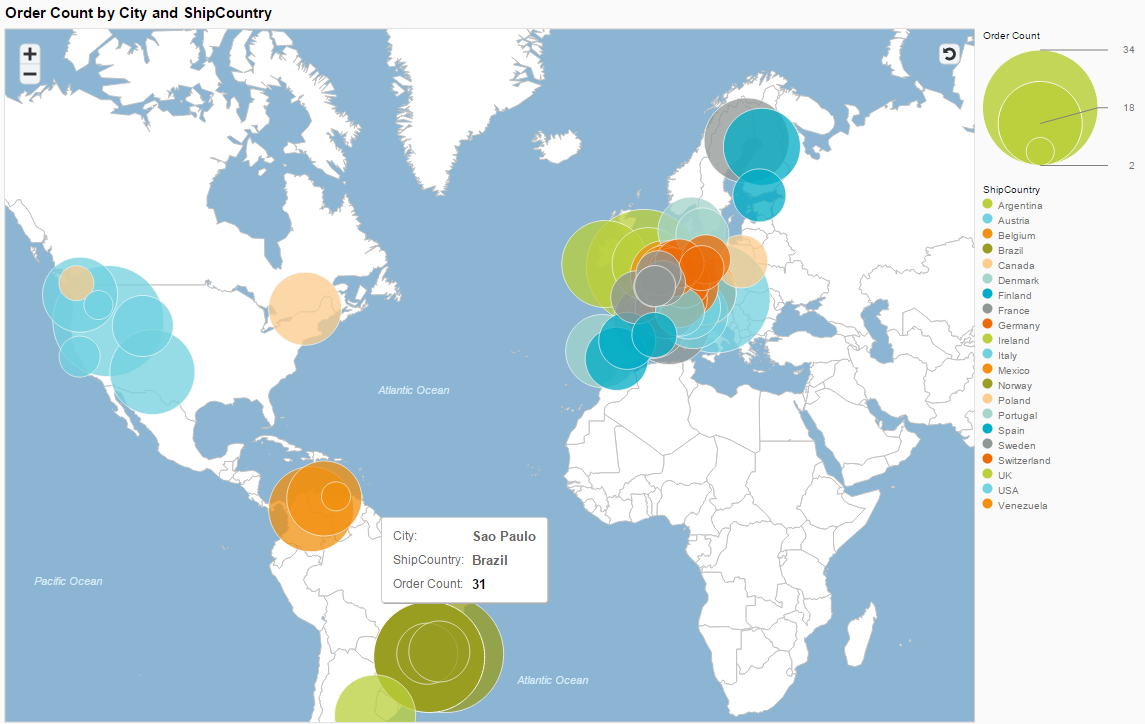
Here is a fancy visualization of sales orders fetched from OData service displayed based on city and country details using the geography hierarchy model in SAP Lumira reporting tool.
I like using the SAP Lumira self-service BI tool very much, easy to use, fast to learn and rapid for going productive. As seen in this tutorial, consuming OData services is straight forward and after data set configuration all other preparing data and visualizing report sections are same for all data source types.
If you are new with SAP Lumira, you can download SAP Lumira.
Additionally if you want to use data from SQL Server instead of OData services, you can download JDBC drivers to connect SAP Lumira to SQL Server databases.
