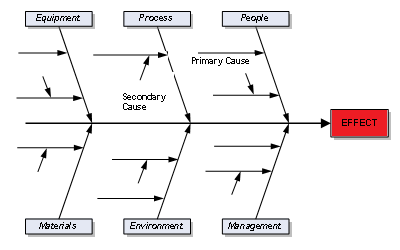
Ishikawa Diagram (Cause and Effect, Fish-bone diagram)
Ishikawa diagram or Cause and effect diagram is also well-known as Fish-bone diagram. Cause and effect diagram aka Fish-bone diagram is used to identify and register the potential root causes of possible problems for a more effective quality control.
Ishikawa diagram is first developed by Japanese quality control statistician Dr. Kaoru Ishikawa who has given the name of himself to this new quality control tool.
Since the entire diagram looks like a fish skeleton, "fishbone diagram" name is also frequently used in project management and in quality control.
As seen in below Ishikawa diagram, a possible problem is written on a paper on the right side. As the second step, possible root causes are placed in empty boxes. When the major causes are written, to complete the fishbone, all possible problem causes are written in detail under the root cause.

Project managers can use the free printable empty fish-bone template from vertex42. You can list all possible causes for the targeted problem listed under root causes using this cause and effect diagram template.
An other free download template is for Microsoft Office which can be downloaded at Office Templates titled as cause and effect diagram. You can find other Ishikawa diagrams for Microsoft Office software for free download to use as a template online from Office Templates.
