Update Table Data for Uniform Distribution in SQL
On SQL Server database table, if SQL developers want to create equal number of rows or uniform distribution among data categories database programmers can use SQL script given in this tutorial.
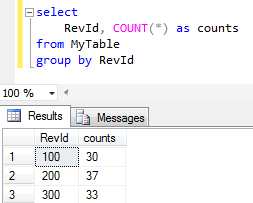
The original SQL table data is having a distribution on selected column as follows
;with summary as (

 SELECT distinct

  COUNT(*) Over (Partition By 1) Cnt,

  RevId,

  COUNT(RevId) Over (Partition By RevId) RevCnt

 FROM MyTable

), todo as (

 select

  Cnt,

  Cnt / (count(*) over (partition by 1)) Average,

  RevId, RevCnt

 from summary

), joint as (

select

 id,

 MyTable.RevId,

 orderno = ROW_NUMBER() over (partition by MyTable.RevId order by id),

 Cnt,

 Average,

 RevCnt,

 RevCnt - Average as forupdate

from MyTable

inner join todo on MyTable.RevId = todo.RevId

), upd as (

 select * from joint

 where RevCnt < Average and orderno <= (forupdate * -1)

 union all

 select * from joint

 where RevCnt > Average and orderno <= forupdate

), final as (

select

 id, RevId,

 case when forupdate > 0 then 1 else -1 end as overAvg,

 rn = ROW_NUMBER() over (partition by (case when forupdate > 0 then 1 else -1 end) order by id)

from upd

)

update MyTable

set

 RevId = ISNULL(n.RevId,p.RevId)

from MyTable t

inner join final p on p.id = t.id

left join final n on p.rn = n.rn and n.overAvg = -1

where p.overAvg = 1
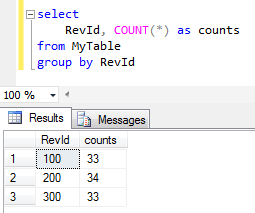
After above SQL update statement is executed, table data is now having a uniform distribution on selected column
Unfortunately, I realized that above update is not sufficient in some cases.
Assume that our values are distributed as seen in below numbers in our sample database table.
As you will realize, I had a total number of 100 rows at first sample.
Then for following case, I had introduced two new groups of rows in low numbers.
5 new rows for category 400 and 5 rows for category group 500
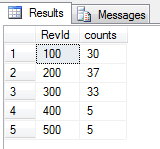
After we execute above code, the updated data will have below count values.
Since the count difference between minimum group (with 5 rows) and target distribution count (100+5+5)/5 = 22 is bigger than minimum group count (5), the distribution is not uniform even after first correction.
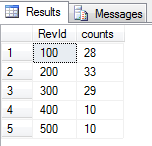
An other attemp to make numbers equal among different categories or groups by running the same script once more will improve the result
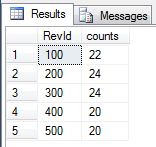
If not satistied with the result, let's try again. Execute the exact SQL script again. And then check the final situation on value distribution on table data.
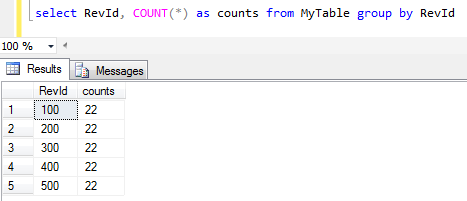
Yes now it is all uniformly distributed :)
