How to Build Your First Report In MS SQL Server 2005 Reporting Services
Run SQL Server Business Intelligence Development Studio from the Microsoft SQL Server 2005 program group.
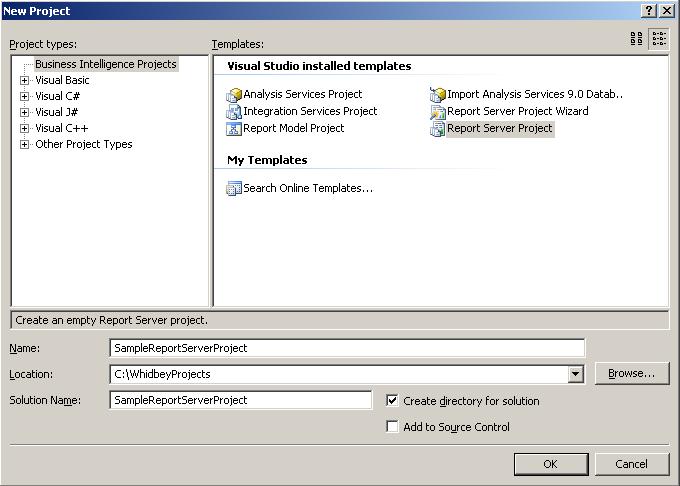
On the File menu of the development studio IDE, go to New and then select Project to open a new project by using preinstalled visual studio project templates.
From the Project Types screen on the left select Business Intelligence Projects as the project type.
On the right of the New Project screen Business Intelligence project templates are listed.
From the installed Visual Studio templates select Report Server Project.
In the Name textbox give a name for your Report Project.
You can also set the name of the solution if you want by editing the value in the Solution Name textbox.
By default a new folder will be created for your solution.
By clickling the OK button the project will be created.
The solution will displayed in Solution Explorer window.
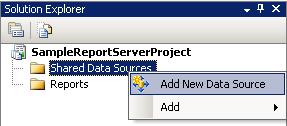
On the Solution Explorer window open the context menu by right click on the Shared Data Sources to add a new Shared Data Source.
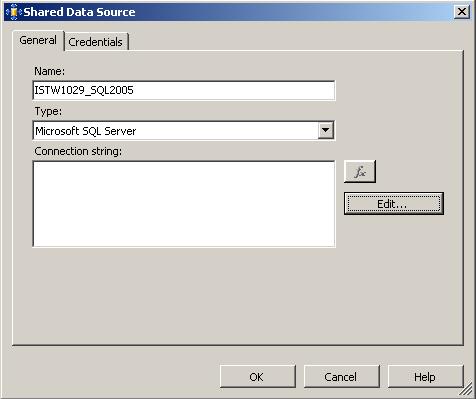
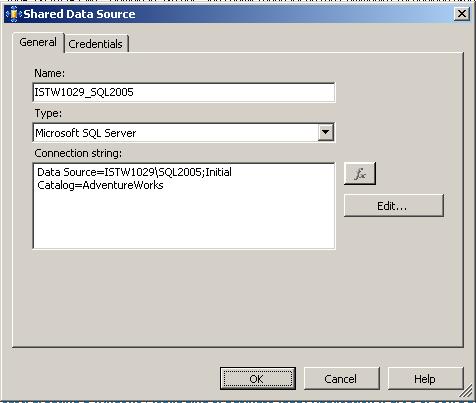
Give a name to the shared data source by entering into Name textbox. Since we are going to use the database named "" in my local SQL Server 2005 installation as the source of the sample report, select "Microsoft SQL Server" as the value of the combo box named Type which indicates the data source type.
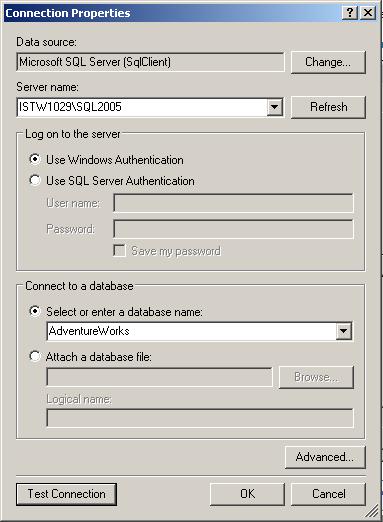
Select the server name from the combo box which is listing the available SQL Server instances. Then after selecting the SQL Server instance you can define the database to work with this data source. You can test the availability of the connection by clicking the "Test Connection" button.
The resultant screen for the newly defined Shared Data Source will be as follows.
You can see the connection string of the data source:
Data Source = ISTW1029\SQL2005;Initial Catalog=AdventureWorks
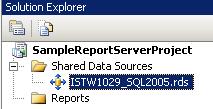
After the data source is defined it will be listed under the Shared Data Sources in the Solution Explorer.
When we are ready with the data source we can go to next step, creating the sample report.
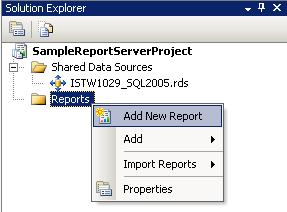
After selecting the "Add New Report" in the context menu of the Reports item in the solution explorer, the Report Wizard will be activated.
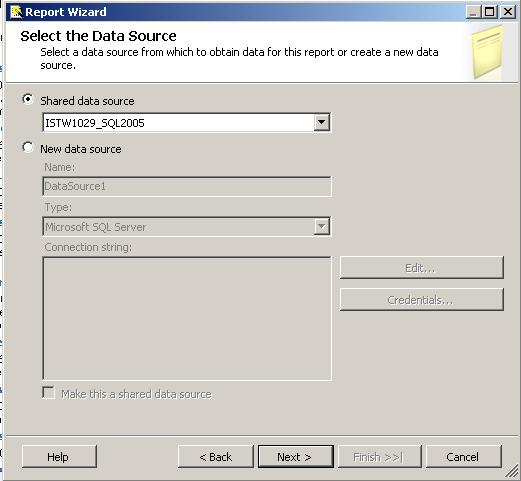
After the first screen of the wizard the next screen is for selecting the data source of the report.
You can select one of the defined data sources in the Shared data source listbox or you can create a new one by selecting the New data source radio box. We will go with the data source we have just created.
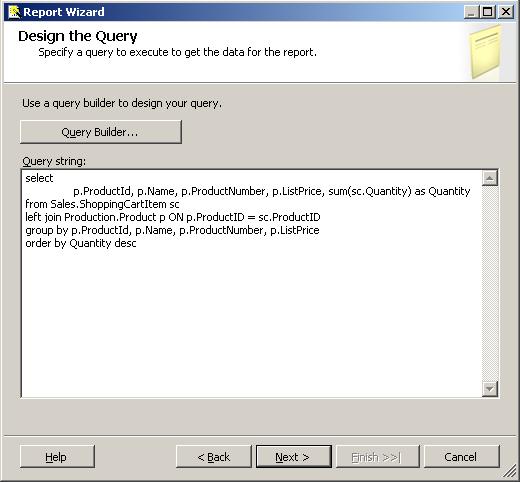
The next screen in the Report Wizard is the Query Design screen. You can either use the Query Builder to set the source of the report or set the value of Query string textbox in order to set the sql statement for gathering data of the report.
The sample report will list the products in the shopping carts and show the sum of quantities of these products which are in shopping carts.
The query string for the report is:
select
p.ProductId, p.Name, p.ProductNumber, p.ListPrice, sum(sc.Quantity) as Quantity
from Sales.ShoppingCartItem sc
left join Production.Product p ON p.ProductID = sc.ProductID
group by p.ProductId, p.Name, p.ProductNumber, p.ListPrice
order by Quantity desc
The next screen is used for setting the report type. Set the report type as Tabular for this report where you can either select the Matrix for the type of the report.
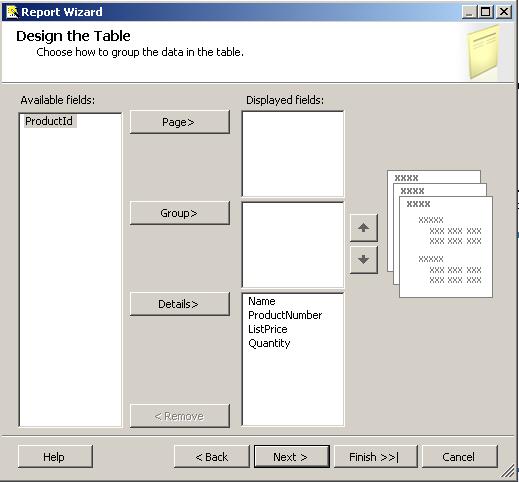
In the screen where its title is Design the Table, you can manage grouping in the table view of your report. You can define the field which will be used for the report, which fields will define the groups, and which fields will form the details for the groups.
If you only want to end with a table view, place the field of this table into the Details section.
The next screens are for setting the style of the table and setting the name of the report. I used a name ProductsInShoppingCarts for this sample report.
After the completion of the Report Wizard, the screen view of the Visual Studio will be as follows.
You can see above how the header of the report, table and its fields with the defined style is set by the wizard. Also the new report is now listed under the Reports item in the Solution Explorer.
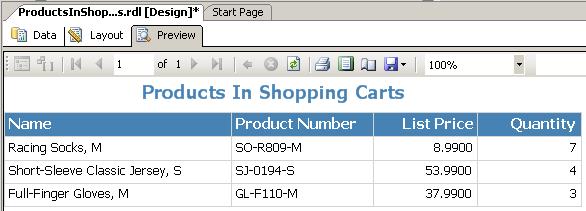
You can preview the report by selecting the Preview tab of the reports screen.
After creating the sample report, the next step will be deploying it to the report server.
The deployment process consists of deployment of the report (.rdl) itself and the necessary data source files (.rds)
For a successfull deployment you should first set the target server for the deployment.
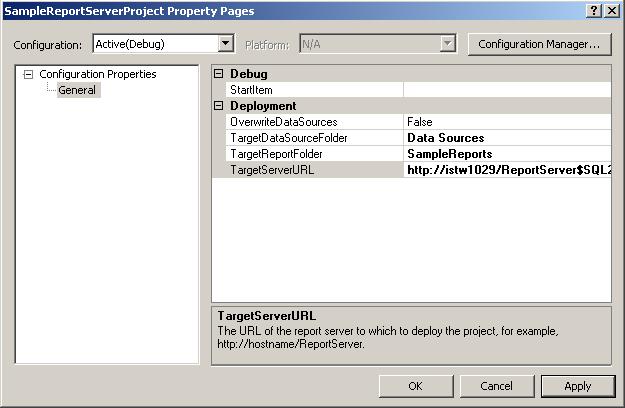
The setting of the target server is managed by the properties of the report project.
If you open the properties screen of the report project, you will see the target server URL, for my sample application I set it to http://istw1029/ReportServer$SQL2005.
The target report folder is the folder where the deployed reports will be placed on the target report server.
If you write here a non-existing folder on the server, then it will be created.
The default target report folder name is same with the report project name.
But you can change it if you want. I changed the name of the target report folder to SampleReports.
Target data source folder is where the shared data sources used by the deployed reports will be placed.
Note that OverWriteDataSources parameter which is set to false by default defined whether existing data sources will be replaced or not if a shared data source with the same name is being deployed.
Generally, data sources are reconfigured after a deployment is done to a report server in order to point to related data sources other than used ones during the development by the server admins.
Or you may change the data sources prior the first deployment to reflect the related data sources for that servers configurations.
So keep the over write data sources parameter as false.
After you have set the required appropriate configuration for the deployment, you can deploy the report project as whole or if you want to deploy only one item let's say for our example the newly created sample report ProductsInShoppingCarts.rdl file you can deploy one by one or selecting more than one item by using Ctrl key to figure the items.
After selecting the project, or only the desired items on the Solution Explorer screen, right click the mouse to open the context menu and then select the Deploy item to start the deployment process.
When the deployment of the reporting services report project items has begun, you will see the process on going on the Output screen in the Visual Studio IDE.
------ Build started: Project: SampleReportServerProject, Configuration: Debug ------
Build complete -- 0 errors, 0 warnings
------ Deploy started: Project: SampleReportServerProject, Configuration: Debug ------
Deploying to http://istw1029/ReportServer$SQL2005
Deploying data source '/Data Sources/ISTW1029_SQL2005'.
Deploying report '/SampleReports/ProductsInShoppingCarts'.
Deploy complete -- 0 errors, 0 warnings
========== Build: 1 succeeded or up-to-date, 0 failed, 0 skipped ==========
========== Deploy: 1 succeeded, 0 failed, 0 skipped ==========
You see the result of the deployment on the last statement of the logged steps.
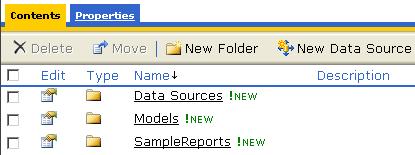
After the deployment is succeeded browse the Reports folder of your Reporting Services installation, you will see the SampleReports folder created in the Home directory.
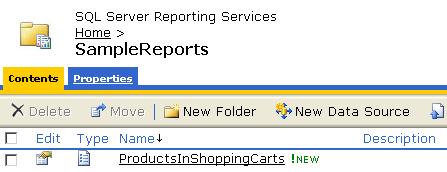
And the ProductsInShoppingCarts report is created in the SampleReports folder. You can run the report by clicking the name of the report.

